
|
|
The Preservation Index and the Time Weighted Preservation Index |
The clever people at the Image Permanence Institute have come up with a way of assessing the suitability of a storage area for preserving artifacts. The "Preservation Index" (PI) and the ponderously named "Time Weighted Preservation Index" (TWPI) are now entering the jargon of the preservation industry.
The Preservation Index is an attempt to link two fundamental characteristics of an environment, temperature and relative humidity, with the rate of chemical deterioration of materials. It is based on a detailed study of one exemplary reaction: the hydrolysis of cellulose acetate, a plastic which is the base for much photographic film. IPI has proposed that its detailed quantitative study of this material's decomposition can be used as a general indication of the aggressiveness of an environment to a wide variety of museum objects and has derived a formula to reduce the measured values of temperature and relative humidity to a single number which predicts the likely lifetime of materials in that particular environment.
Since most naturally ventilated storage places have a varying climate, the IPI has also devised an indicator of the average aggressiveness of the indoor climate. This is the Time Weighted Preservation Index.
IPI has now launched a complete kit with data logger, memory card and Windows(TM) program, which computes these indexes of instantaneous and long term climatic aggressivity from measurements of temperature and relative humidity. Existing climate data also can be entered into a computer program which calculates the time weighted preservation index. These numbers have already been cited, with success, in applications for funds to improve the storage rooms of museums. These dataloggers, installed in a Baroque room with original furnishing, generally predict a lifetime around 50 years for the contents. Since no-one else has remarked on this odd result, I take a close look at the measurements, theory and assertions that support the PI and its derivative, the TWPI. I also review alternative descriptions of the interactive influences of temperature and relative humidity on the degradation of artifacts.
Cellulose acetate is made by treating cellulose with a mixture of acetic acid, acetic anhydride and sulfuric acid. The sulfuric acid acts as a catalyst and as a dehydrating agent. The reversible reaction can be summarised thus:
Cel-OH + H-Ac <-> Cel-Ac + H-OH
The Cel-OH is shorthand for the repeated ring groups of cellulose, each with three hydroxyl groups attached. The H-OH on the right hand side is water, which is removed from the mixture by its strong affinity for concentrated sulfuric acid. This encourages the reversible reaction to go to the right, because an essential ingredient for the reverse reaction, water, is steadily removed as it is produced.
In the industrial manufacturing process, cellulose is transformed completely into the tri-acetate, with three acetate units per cellulose repeat unit. Cellulose triacetate was the subject of the IPI experiments but it is interesting to note that the degradation reaction they studied is also used as a deliberate industrial process to make the equally commercially valuable cellulose di-acetate. This is made by treating the tri-acetate with a weaker acid solution, where the water is abundant, so the reaction goes back towards the left: a mixture of cellulose and acetic acid. It is stopped after one acetate group has been removed per cellulose unit by washing out the acid and drying the di-acetate that has been formed, thus removing both the catalyst and the water.
Both forms of cellulose acetate have been used as the support layer for film. The film is exposed, developed, viewed and occasionally judged worthy of preservation. However, the reverse reaction described above continues slowly in the film base as it lies in the museum archive.
The description of the rate of this reaction is the main subject of this article. We need to explore the action of two chemical laws, both formulated in the nineteenth century and soon confirmed by both theoretical thermodynamics and abundant experimental evidence. The first is the law of mass action and the second is the Arrhenius law of the change of reaction rate with temperature.
The law of mass action is quite intuitive. It states that the rate of a chemical reaction is proportional to the concentration of each reactant. In the case of cellulose acetate degradation the reaction rate can be described thus:
Decay rate = kdegr × [celluloseacetate] × [H2O]
Where kdegr is a constant and the terms within square brackets are the concentrations of the reagents which appear in the formal equation for the reaction.
This reaction begins to generate acetic acid and cellulose, or at least a less acetylated cellulose, as soon as it starts. So there is immediately competition from the reverse reaction which tries to regenerate cellulose acetate. Its rate is:
Regeneration rate = kregen × [cellulose] × [aceticacid]
If all the components remain in the reactive stew, the two reactions will reach an equilibrium when the rates in each direction become equal, with concentrations for the four components balancing the influence of each other and the rate constants k.
Ester hydrolysis reactions very similar to this have been used to confirm the validity of the law of mass action; the reversible hydrolysis of ethyl acetate to ethyl alcohol and acetic acid, is a classic example.
In the film archive, however, the components do not remain at the site of the action, so the equilibrium is disturbed, but entirely in accordance with the law. The acetic acid is volatile and will escape. Water however, is always present in air. The effect will be to drive the equilibrium all the way over to the cellulose + acetic acid side of the equation, because there is no competition: if there is no acetic acid, there will be no reaction, whatever the value of kregen and however much cellulose is present.
We can therefore simplify the description of the initial rate of the first stages of the decay reaction of cellulose acetate. The rate will be:
Decay rate = kdegr × [celluloseacetate] × [H2O]
The value of the constant k is found by experiment, being only calculable for very simple reactions. The concentration of cellulose acetate is 1: it is a pure solid. The concentration of water is worth a brief discussion. Cellulose acetate contains very little water: at 20°C and in equilibrium with 50% RH it has only around 1.5% water by weight. With so little water one would surely expect a slowing of the reaction compared with a laboratory exercise where everything is performed in solution. However, an examination of the thermodynamics suggests that a correct measure of the effective concentration of water, the value to use for [H2O], is the relative humidity around the solid cellulose acetate, in equilibrium with its low water content.
This may surprise you. Consider a saturated salt solution: saturated sodium chloride in water is 36 g per 100 ml of water, which corresponds to approximately 20% of sodium plus chloride ions in the solution, or 80% of water molecules by number (not weight). This neatly (but approximately) explains why the relative humidity above the solution is 76%. The concentration of water in the air above the solution, 0.013 g/l at room temperature, is much less than the concentration in the beaker of salt solution, 847 g/l, but its chemical potency is the same. This same air is in equilibrium with about 2% water in cellulose triacetate. Again, the chemical potency is the same so one can use the RH in equilibrium with any reacting mixture as a measure of water activity, as the chemical jargon describes it. The low water concentration in the plastic may inhibit reaction by other means: water has to diffuse into the plastic to replace that lost by reaction but in a reaction which takes years to complete this is not a significant influence.
The degradation rate is therefore proportional only to the relative humidity. This is found to be true for many such reactions involving the air as the supplier of the water component in the reaction scheme. According to the IPI researchers' data, it is approximately true for this particular reaction, though they chose to use the RH in an empirical fit to the observed data rather than invoke the law of mass action.
This proportionality between RH and typical reaction rates of hydrolytic decay was used in 1994 by Don Sebera in constructing his elegant concept of the "Isoperm": a locus of constant reaction rates in relative humidity-temperature space. He modestly claimed accuracy only for a small excursion from the RH at which the reaction had been measured, but this modesty was perhaps unnecessary - according to the law of mass action, proportionality should hold from zero to 100% RH.
There are other curious consequences of the law of mass action. One could in principle pump acetic acid vapour into the film can to shove the equilibrium over towards the acetate, thus counterbalancing the influence of water, whose presence has to be accepted to ensure the dimensional stability of the film. This would not be a good idea, for an unexpected reason: acetic acid unfortunately catalyses the reaction, a form of participation that is not expressed in the formal equation above.
Merely being out of equilibrium is fortunately not a guarantee that a reaction will proceed at speed, otherwise conservators would be guarding piles of ashes of almost all artifacts. The second law that we must use to complete our account of the degradation of cellulose acetate is the Arrhenius law, which predicts the change of reaction rate with temperature.
Abundant experimental evidence, and theoretical arguments, lead to the idea that the rate of reaction depends on some molecules in the reactive mix reaching an unusual energy, sufficient to break chemical bonds and facilitate their re-arrangement to form the reaction products. It was the Swedish scientist Svante Arrhenius who proposed, in 1889, that the material in the reaction flask, in his example a sugar not unlike cellulose, was always in equilibrium with a very small amount of an activated version of the molecule, whose abundance relative to the inactive molecules increased sharply with temperature and which, when it had reacted, was always replaced by new active molecules, in constant ratio to the mass of the material.
This inspired insight was later confirmed by quantum mechanical calculations. The subject is most understandably approached by considering molecules as flying around in space and bumping into one another, like snooker balls on a table whose side cushions are in constant random vibration, representing thermal movement. It turns out that more complicated physical arrangements, such as absorbed water in a reactive solid polymer, follow the same laws, so for simplicity of explanation the gas model, played in two dimensions on a billiard table, is adequate to give an intuitive idea of what is going on.
As the balls collide with the cushions and with each other, some will, momentarily, be moving faster than most, because of a recent history of advantageous collisions, while a few balls will, at any instant, be almost stationary as a result of a stunning head-on encounter.
The distribution of speed among the balls (in three dimensions now), was worked out by Maxwell and Boltzmann in the second half of the nineteenth century. Figure 1 shows the way velocity is distributed in a large collection of molecules of water vapour at various temperatures.
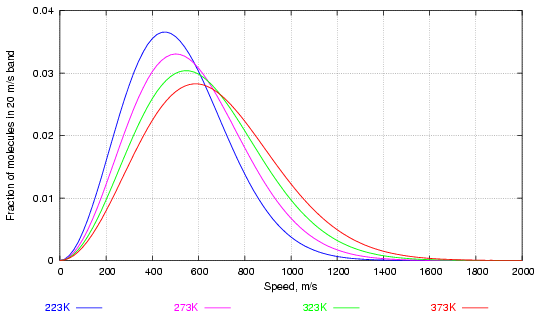
Figure 1. Distribution of water molecules by speed at various temperatures (in degrees Kelvin, 273K = 0°C)
Notice how increasing the temperature considerably increases the fraction of high velocity molecules while altering much less the most frequent velocity, corresponding to the peaks of the curves.
The tendency to react depends not on the speed of collision but on the energy embodied in the molecule. The energy is proportional to the square of the velocity, so the energy graph, figure 2 below, gives a more dramatic emphasis to the abundance of high energy molecules at higher temperature.
A bond between atoms breaks because of its high vibrational energy, rather than because of the high velocity of the entire molecule. A rigorous dissection of the problem reveals that the pattern of vibrational energy distribution is the same as that of the translational energy, a finding which is named the Equipartition Principle.
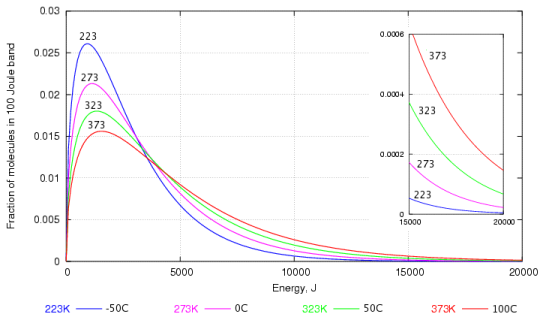
Figure 2. The energy distribution of water molecules at various temperatures. The high energy region is enlarged in the inset graph.
Again, one can see that the most frequent energy, the peak of the curve, doesn't rise very quickly with temperature but the proportion of very high energy molecules increases dramatically with temperature, as shown by the enlarged portion of the graph at the right.
The early investigators of the rates of chemical reaction were puzzled because the increase in reaction rates with temperature was vastly greater than the increase in average energy of the molecules, which is not far from the peak values shown in the graph. An explanation based on the increasing abundance of molecules with very high energy fitted much better the observed reaction rates: reaction occurred only among the tiny fraction of molecules with very high energy. The limiting energy below which molecules will not react, however often they clash, is now called the Activation Energy of the reaction. The fraction of molecules with more than this energy is given by the expression:
e(-E/RT)
where E is the activation energy, R is the gas constant, which is merely there to reconcile the units of the variables, and T is the Kelvin temperature.
If, for example, one plots the fraction of water molecules above 15kJ/mol energy against temperature, one gets an exponential curve, shown in figure 3 in blue. This shows how rapidly the number of reactive molecules increases with temperature. The red curve is the fraction of molecules above 25 kJ. This is always a much smaller number than the number over 15kJ, so the 25kJ fractions are here multiplied by 20, just to bring the two curves into the same graph frame. Notice that the abundance of molecules with energies above 25kJ rises more sharply with temperature than the abundance of molecules with energies above 15 kJ. This means that reactions with a high activation energy will be much more accelerated by a rise in temperature. This important observation is demonstrated in another, less abstract, graph later.
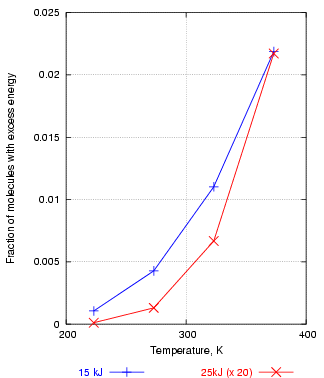
Figure 3. The number of molecules with energy over 25kJ increases with temperature more steeply than the number over 15kJ, explaining why reactions with a high activation energy are more powerfully accelerated by high temperature.
Returning now to our main theme, we can combine the mass action law with the dependence on the temperature according to the Arrhenius concept. The rate of the reaction between water and cellulose acetate can now be expressed as
k = [RH] × A × e(-E/RT)
where the rate k can be expressed in any way: change of viscosity, tensile strength, acetate content; as long as these measurements can be shown to be proportional to chemical change of some sort. The [RH] comes in as already explained, it is the only variable chemical influence on the rate of reaction. The constant A is a temperature independent number that bundles several factors: a correction for different units for expressing the rate, the entropy change and the chance of the molecules being oriented correctly for reaction.
The exponential term representing the fraction of molecules over the activation energy is, for fairly stable molecules, very small indeed: E/RT is typically (100000/8.314 × 293), giving a fractional abundance of molecules over E of 1.5 × 10⁻¹⁸.
For the decay of cellulose acetate the rate equation that fits the published IPI data quite well is this:
k = [RH%] × 5.9 × 10¹² × e(-90300/(8.314 × T))
The unit for k is the fraction per year of the degradation which according to IPI marks the end of useful life of the film.
This equation describes the hydrolytic deterioration of cellulose acetate. It is specific to this reaction and has no general validity. It does not even account for the rate of hydrolysis when, in a closed container, the acetic acid produced has reached a concentration which not only promotes the reverse, reconstructive, reaction but vastly increases the rate of the decay reaction through acid catalysis. The hydrogen ion from the acid adds on to the ester group, giving it a positive charge which makes it more accessible to attachment to the negatively charged end of the dipolar water molecule. The reaction rate is strongly affected by pH, it increases in both acid and alkaline conditions. This does not break the laws described above - it merely indicates that the activation energy has changed, downwards, as the pH shifts away from 7. The manufacturing process leaves the residual acidity of the cellulose acetate poorly defined, so the rate of initial reaction is variable between batches. Film archivists are aware of the sporadic nature of film decay. Finally one must note that the film is plasticised by other esters, which themselves hydrolyse to give acidic products. The triphenylphosphate esters are catalytically decomposed by acetic acid to produce non volatile acids which remain in the film.
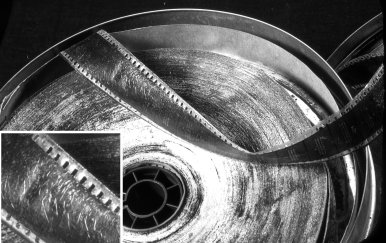
Figure 4. Needle shaped crystals of triphenylphosphate (see enlargement lower left) are growing between the gelatin and the cellulose acetate base of this microfilm roll. The air in the metal can smelled strongly of acetic acid. The phosphate ester plasticiser is so poorly compatible with the regenerating cellulose that it diffuses to the surface and crystallises just below the gelatin layer.
The brave folk in the Image Permanence Institute have nevertheless chosen to use the kinetics of this film base as a representative reaction to define the suitability of storage climate for all artifacts.
The IPI scientists' manipulation of their experimental data for cellulose acetate deterioration is more tentative than mine, but the use they make of their results is vastly more ambitious.
The IPI researchers have not invoked the mass action law, they have regarded relative humidity as an influence separate from the chemical components participating in cellulose acetate hydrolysis. Their data are fitted to an empirical look-up table of life expectancy years, put into the spaces of a grid of temperature and relative humidity. They have also fitted these numbers to an equation which has the exponential form of the Arrhenius plot, but which includes RH as a temperature dependent factor. This is added to the activation energy. There is no theoretical justification for this, because the activation energy itself includes the participation of water. This procedure may give a better fit, but it reduces the authority for using this reaction as typical of the class of hydrolytic reactions which afflict many cultural materials.
Here is the IPI formulation of the reaction kinetics:
years to a defined state of deterioration =
exp((E - 134.9 × [RH%])/(8.314 × T) + 0.0284 × [RH%] - 28.023)/365
The modified activation energy E is set to 95220 J/mol to give the best fit to the cellulose triacetate deterioration data. Notice however, that the first of the two RH terms is added to the activation energy, so the value of E is not a true activation energy which can be compared with published data from other experiments. T is in degrees Kelvin.
Notice that the 'rate', which the IPI has named the Preservation Index (PI), is here given as a reciprocal rate: the life expectancy in years. This was done to give more psychological punch to the number: a lifetime prediction, 30 years, for example, being considered to have more dramatic impact than a rate of 3% deterioration per year.
A rate derived from a single reading of temperature and relative humidity is not too good a predictor of damage that takes many years to become significant, so the lifetime calculated over a year of hourly measurements would be a better basis for judging the quality of a store that is not air conditioned to a constant climate.
The IPI gave the resonant title "Time Weighted Preservation Index" to this average value of the PI. "Time averaged" would be more understandable, but there is prestige in a carefully calculated degree of obscurity.
There is, however, a penalty for choosing life expectancy as the unit of deterioration: it complicates deriving the average lifetime expectancy.
I will clarify the matter with a simple example:
If you run your film archive at 30 degrees and 80% RH you can expect your film to be sticky powder in 30 years, according to the IPI lookup table. If, however, your archive is only like this in summer but is 4 degrees and 60% RH in winter, the expected life, according to the lookup table for the winter conditions, is 300 years. So how do these figures even out over the cycle of years?
You can first try averaging, but the result, 165 years, is unconvincing. Since the film is degenerating for half the year at a rate leading to death at 30, even an entirely benign winter half year with no decay at all could not raise the life expectancy over 60 years.
The problem lies in the choice of lifetime instead of rate of deterioration to express the PI. If one were to quote the summer PI as a deterioration rate of 1/30 = 0.033 (or 3.3% to make it look more dramatic), one can average this with the winter rate of 0.0033 (a rather unthreatening 0.3%) to give a year by year rate of 0.018, which is obviously nearer the mark. One can finally, if one wishes to frighten the director into funding a new cooler, change this back to a life expectancy of 56 years, which indicates that the summer is the time most of the deterioration happens.
The difference between the empirically derived Preservation Index and the best fit to the orthodox mass-action/Arrhenius analysis is quite small. The main difference is in the effect of RH and its significance depends on how accurately RH was measured during the experimental reaction (I believe that the RH was deduced from the water content of the film, rather than measured directly). The discrepancy is insignificant in practice because the deterioration of other polymers is governed by different activation energies that give considerably different behaviour.
This is clearly shown in the next graph. The climate and dates are fictitious, designed to show how the rate of deterioration changes over a wide gamut of temperature and relative humidity. The rate for cellulose acetate, according to the IPI, is compared with that predicted by the same data fitted to a simple mass-action/Arrhenius formula (TPI). I have added a fictional reaction rate of cellulose nitrate, using the activation energy published by IPI and a constant term adjusted to give a similar rate to cellulose acetate at 20°C and 50% RH, so that the shape of the curves can be better compared.
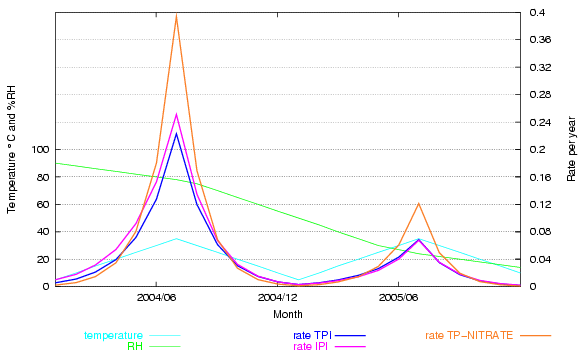
Figure 5. A fictitious climate ranges over various combinations of temperature and relative humidity. Two predicted rates of deterioration for cellulose triacetate are shown, the IPI prediction and an orthodox mass-action/Arrhenius fit to the same IPI data. The two predictions deviate a little at high RH. An Arrhenius plot for cellulose nitrate degradation, using the activation energy from IPI research, shows the very strong acceleration of the reaction at high temperature - deviating substantially from the IPI rate for cellulose acetate.
This graph shows that the IPI empirical approach is not really necessary. By using a unique fit for a particular reaction they fail to demonstrate its near compliance with laws that have been shown to account quite accurately for many reactions over more than a hundred years of experiment.
The other obvious conclusion from the nitrocellulose trace on this graph is that the activation energy of an individual reactions is a very important determinant for the influence of temperature on durability. Activation energies of reactions of relevance to conservation vary widely, so their sensitivity to acceleration by temperature is also very different.
On the next page I will discuss the products offered by the IPI to help you manage your storage and display areas and show an example from a real museum.
I thank Douglas Nishimura of IPI for his explanation of the mathematical basis of the PI and the TWPI and I thank him, and his colleagues at IPI: Jim Reilly and Peter Adelstein, for interesting discussions over many years.
The basic reference for the PI and the TWPI is:
James M. Reilly, Douglas W. Nishimura, Edward Zinn, 'New Tools for Preservation, assessing long-term environmental effects on library and archives collections' The Commission on Preservation and Access, Washington DC, 1995, ISBN: 1-887334-46-7. Available also from the IPI website, for a small fee.
The mechanism of ester hydrolysis is described in:
http://www.chemguide.co.uk/physical/catalysis/hydrolyse.html
The identity between relative humidity and the chemical activity of water is as vital to biological growth as it is to the death of film, but the subject is strangely absent from basic science textbooks, which tend to deal with laboratory fluids. A classic text on the subject is: Slatyer, R. O., Plant Water Relations, 1967 Academic Press, but most books on plant physiology and environmental microbiology cover the subject.
The temperature dependence of the rate of reaction is a brain-stressing read, discussed with varying clarity in many undergraduate textbooks on chemical kinetics and a vast number of web pages, mostly even more superficial than this one. You might need to read several alternative descriptions to reach closure, as one nowadays describes coming to peace with something difficult.
Don Sebera introduced the concept of the isoperm in the late nineteen eighties, I believe. Here is a reference from 1994:
http://palimpsest.stanford.edu/byauth/sebera/isoperm/
A similar plot of isoperms is published in the ASHRAE (Americal Society of Heating Refrigeration and Air Conditioning Engineers) Application Handbook, Chapter 21, p4, 2003. It is not clear how they are calculated.
Tim Padfield, September 2004

This work is licensed under a Creative Commons Attribution-Noncommercial-No Derivative Works 3.0 License.